

El Niño and the Future of Global Potato Production
The potato is one of the world’s most important food crops and one of the most sensitive to weather. It grows best in cool conditions, with shallow roots that dry out quickly. Tuber formation slows when night's stay above about 20°C. That makes potato yield and quality closely tied to the heat and rainfall patterns that El Niño reshapes every few years.
El Niño does not damage potatoes directly. It warms the tropical Pacific and shifts tropical rainfall eastward, which changes weather far away. Some regions get drought and heat, such as southern Africa, India, Indonesia, eastern Australia and the southern Andes. Others get floods and disease pressure, such as East Africa, coastal Peru and southeastern South America. Europe, home to much of the world’s French fry industry, has no consistent El Niño signal at all.
History shows what is at stake. Since 1950 there have been eight strong or very strong El Niño events. In 1997–98, drought cut Bolivia’s potato output by about 40%. In 2015–16, South African growers lost roughly 310,000 tonnes and potato prices hit record highs. In 2023, Peru’s Puno region lost about 40% of its crop. Yet in irrigated systems and in regions outside El Niño’s reach, harvests often held up. Effects on prices and trade depend on where the losses fall.
The risk is also changing. Climate research suggests extreme El Niño events could roughly double in frequency this century and the IPCC judges it very likely that El Niño driven rainfall swings will grow. At the same time, rising temperatures are pushing potato regions closer to their heat limits.
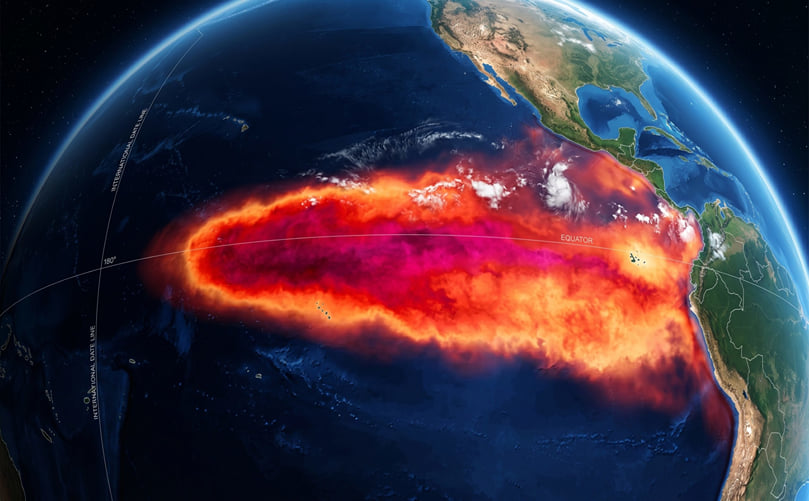
El Niño Drought and Flood Risk by Potato Region
What Is El Niño?
El Niño is the warm phase of the El Niño–Southern Oscillation (ENSO), a natural climate pattern involving changes in sea surface temperatures and atmospheric circulation across the tropical Pacific Ocean. It typically occurs every two to seven years and lasts around 9–12 months, although some events persist longer.
How El Niño Develops in the Pacific Ocean
Under normal conditions, easterly trade winds push warm surface water westward toward Indonesia and Australia. This allows cooler, nutrient rich water to rise from deeper ocean layers along the coasts of Peru and Ecuador, a process known as upwelling.
During El Niño, the trade winds weaken and may occasionally reverse. Warm surface water spreads eastward toward South America, reducing the upwelling of cooler water. As a result, sea surface temperatures rise across the central and eastern equatorial Pacific and tropical rainfall shifts eastward from the western Pacific toward the central and eastern Pacific.
This redistribution of tropical rainfall changes the release of heat into the atmosphere, influencing atmospheric circulation, jet streams and weather patterns across distant regions. These long-distance connections between tropical Pacific conditions and weather elsewhere are known as teleconnections.
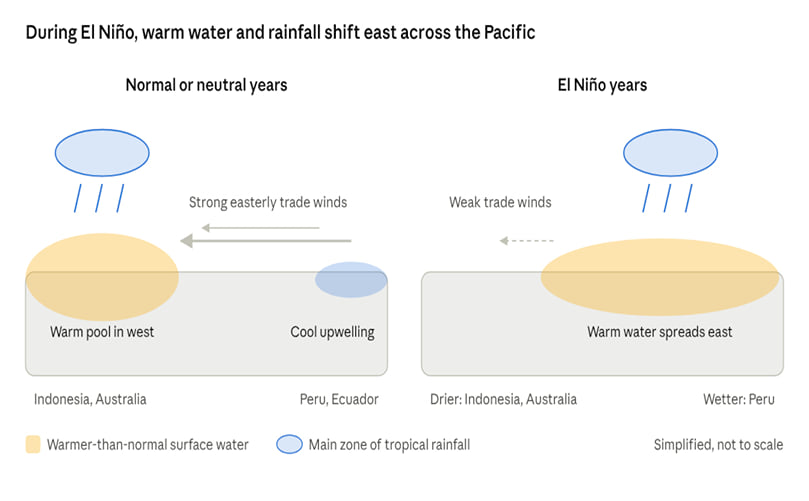
When the trade winds weaken, the Pacific warm pool and its rainfall move east, reshaping weather around the world.
The difference between El Niño, La Niña and neutral conditions
| Phase | Niño-3.4 Sea Surface Temperature Anomaly | Trade Winds | Typical Tropical Rainfall Pattern |
|---|---|---|---|
| El Niño | At least +0.5°C above average | Weaker than normal | Shifts eastward toward the central and eastern equatorial Pacific |
| Neutral | Between −0.5°C and +0.5°C | Generally near normal | Generally concentrated over the western Pacific, including Indonesia |
| La Niña | At least −0.5°C below average | Stronger than normal | Enhanced over Indonesia and the western Pacific; reduced over the central and eastern equatorial Pacific |
NOAA declares an event when these anomalies persist for several overlapping three-month periods and the atmosphere responds. Events above about +1.5°C are commonly called strong; above +2.0°C, very strong.
How El Niño Influences Global Temperature and Rainfall Patterns
El Niño redistributes heat between the tropical Pacific Ocean and the atmosphere, influencing global temperatures and rainfall patterns. Global average surface temperatures often rise during and after a strong El Niño, with the largest warming effect commonly occurring in the year following its peak. However, the timing and magnitude vary between events.
Typical regional patterns associated with El Niño include:
Drier conditions: India’s summer monsoon, Indonesia, eastern and southern Australia, southern Africa, Central America and parts of northern South America.
Wetter conditions: Coastal Peru and Ecuador, southeastern South America (including southern Brazil, Uruguay and northeastern Argentina), East Africa during the short-rains season and parts of the southern United States during winter.
Warmer winters: Western Canada and parts of the northern United States.
These are broad tendencies, not guaranteed outcomes. The strength, timing and geographical extent of the effects vary from one El Niño event to another.
Why El Niño Impacts Differ Between Countries and Growing Seasons
El Niño’s influence depends on geographical location, season and the interaction of other climate patterns. Teleconnections can be pronounced during one season but weak or absent during another. For example, the relationship between El Niño and Indian rainfall is particularly important during the June–September summer monsoon, while its influence on southeastern Australia is often more evident during winter and spring.
Other climate drivers can reinforce or counteract El Niño’s effects. The Indian Ocean Dipole (IOD), for example, can influence the Indian monsoon and modify the effects associated with El Niño. During the strong 1997–98 El Niño, India received near normal monsoon rainfall, illustrating why an El Niño event does not automatically lead to a deficient monsoon.
The consequences for agriculture also depend on local conditions. Irrigation availability, soil moisture, soil type, crop calendars and the timing of rainfall or temperature anomalies all influence whether a climate signal results in crop stress, reduced yields or production losses.
For the potato industry, these regional differences are particularly important. Western and central Europe, major centres of potato production and processing, have a comparatively weak and inconsistent relationship with ENSO. Consequently, El Niño alone is not a reliable predictor of European potato yields or processing potato availability.
A History of Major El Niño Events Since 1950
El Niño is a recurring event, not a rare one. On NOAA's Relative Oceanic Niño Index (RONI), eight El Niño events since 1950 reached strong or very strong intensity: 1957–58, 1965–66, 1972–73, 1982–83, 1991–92, 1997–98, 2015–16 and the developing 2026–27 event (ggweather.com). 2023–24 ranks below these on the relative index, though it counted as strong on NOAA's traditional index.
The biggest events left lasting economic marks. One study estimated that the 1982–83 and 1997–98 El Niños cost the world economy about USD 4.1 trillion and USD 5.7 trillion respectively over the following five years (Callahan and Mankin, Science, 2023). For potatoes, the clearest past impacts were highland droughts in Bolivia and Peru (1982–83, 1997–98, 2023) and southern African droughts (1991–92, 2015–16); the historical section gives the production data.
Strong events have also become more common. A 2023 study of 43 climate models found that ENSO variability increased in 1961–2020 compared with 1901–1960, consistent with more frequent strong El Niño and La Niña events and linked the change to greenhouse warming (CSIRO, 2023).
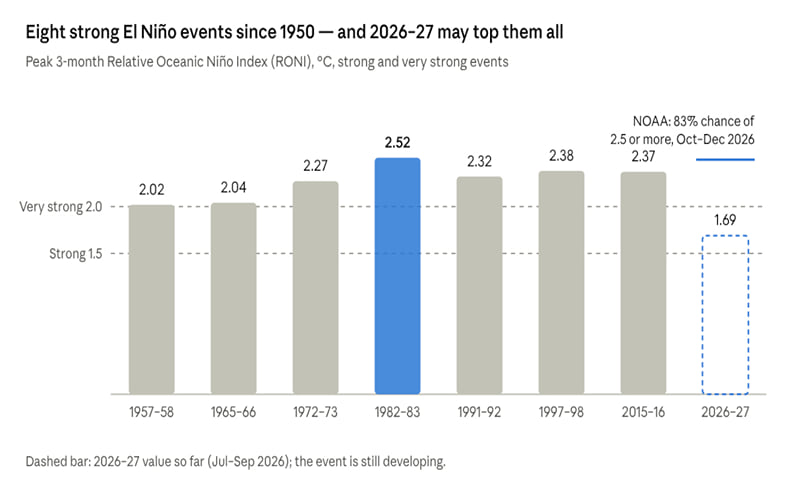
The 1982–83, 1997–98 and 2015–16 events were the strongest on record before 2026–27.
How El Niño Can Affect Potato Growth and Yield
Potato is a cool-season crop with a shallow root system, so short spells of heat or water stress at the wrong stage can cut yield and quality. El Niño matters to potatoes mainly through three channels: hotter days and nights, drought and in some regions too much rain.
Heat stress and potato plant development: Most commercial varieties grow best at air temperatures of roughly 15–20°C, with cool nights. Night temperature is especially important: tuber formation slows when night's stay above about 20°C and can stop above about 25°C (Crop Journal review). Yield losses become significant when plants are exposed to temperatures above about 28°C (Auburn University).
Under heat, the plant favours leaves and stems over tubers. A key tuber signalling gene, StSP6A, is switched down, so less sugar moves from the leaves into the tubers. Varieties differ in a laboratory study, 29°C reduced tuber initiation in heat sensitive Désirée but not in heat tolerant Festival (IBISS, 2018).
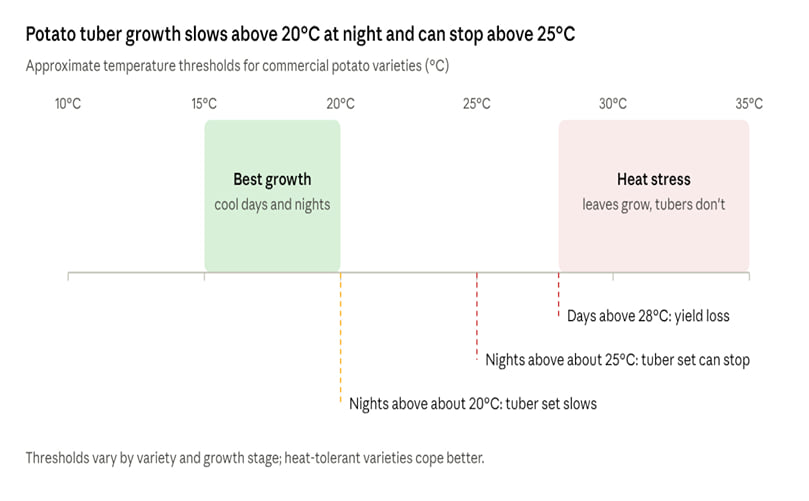
Warm nights are the critical risk: tuber formation slows above about 20°C and can stop above about 25°C.
Drought, soil moisture and irrigation demand: Potato roots mostly sit in the top 45–60 cm of soil, so the crop draws down available water quickly. Emergence and tuber initiation are the two stages where water stress most reduces final yield. El Niño droughts also raise irrigation demand at the same time as reservoirs, canals and groundwater are under pressure.
In rainfed systems such as much of the Andes, East Africa and parts of South Asia a failed or late rainy season can delay planting, reduce the planted area or leave crops with uneven emergence.
Excess rainfall, flooding and waterlogging: Where El Niño brings heavy rain coastal Peru, southeastern South America, East Africa and southern China waterlogging is the main risk. Saturated soils cut off oxygen to roots and tubers. Tubers can rot, lenticels swell and soft rot spreads, especially in warm soils.
Wet, mild weather also favours late blight (Phytophthora infestans), the most damaging potato disease worldwide. Flooded fields delay planting and harvest and can damage roads used to move the crop.
Effects on tuber initiation, bulking and tuber size: The timing of stress matters as much as its strength. Stress at tuber initiation reduces tuber numbers. Stress during bulking reduces tuber size. Stress followed by relief a heatwave or drought broken by rain or irrigation can cause secondary growth, knobs, chain tubers, growth cracks and hollow heart.
| Potato Growth Stage | Main El Niño-Related Stress | Typical Potential Outcome |
|---|---|---|
| Planting and emergence | Dry soil, delayed rainfall or excessive rainfall and flooding | Delayed or uneven emergence, poor plant establishment and late planting |
| Tuber initiation | High temperatures, particularly warm nights, and soil moisture deficits | Reduced tuber initiation and fewer tubers per plant |
| Tuber bulking | Heat stress and drought | Reduced tuber growth, smaller tubers, lower yields and potentially lower dry matter content |
| Stress followed by relief | Rainfall or irrigation after a period of drought, causing rapid changes in soil moisture | Increased risk of tuber cracking, misshapen tubers and internal defects such as hollow heart, particularly when other predisposing conditions are present |
| Maturation and harvest | Heavy rainfall, saturated soils and waterlogging | Increased risk of tuber rots, harvest delays, soil compaction and post-harvest storage losses |
Note: These are potential effects of weather conditions that may occur during El Niño, not universal consequences of the climate phenomenon. Actual impacts depend on the region, potato variety, soil conditions, irrigation, crop management and the timing and severity of the stress.
Potential effects on yield and crop quality: The yield effect depends on how much of the crop is irrigated and how severe the anomaly is. Well-irrigated crops can often hold yield through drought but at higher cost; rainfed crops are more exposed. Heat stress can also damage quality even when total tonnage holds up lower dry matter, more sugar ends and poorer storage. Longer-term research suggests heat stress alone could cut potato production by 18–32% by mid-century under climate change (bioRxiv, 2024), which means each El Niño heat spike lands on a warmer baseline.
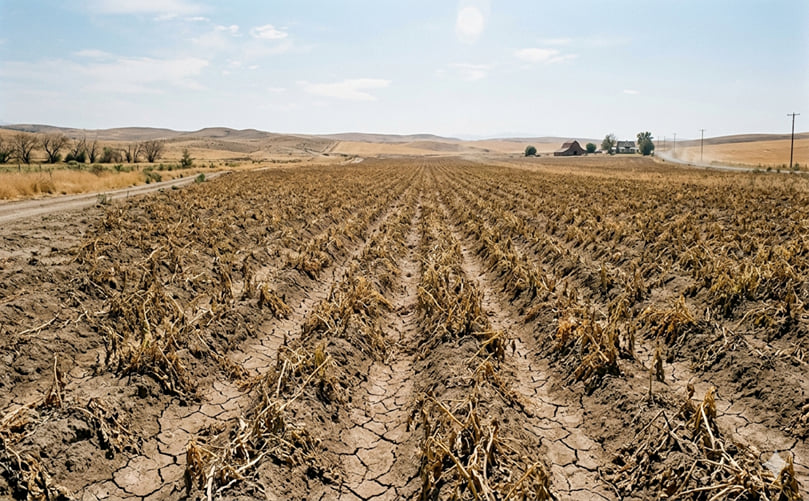
Drought Stress in Potato Fields
Regional Effects of El Niño on Potato Production
The strongest evidence for El Niño damaging potato crops comes from southern Africa and the Andes, where droughts in strong El Niño years coincided with large, documented production falls. Evidence for India is moderate and for Europe and North America it is weak. The table summarizes confidence before the regional detail.
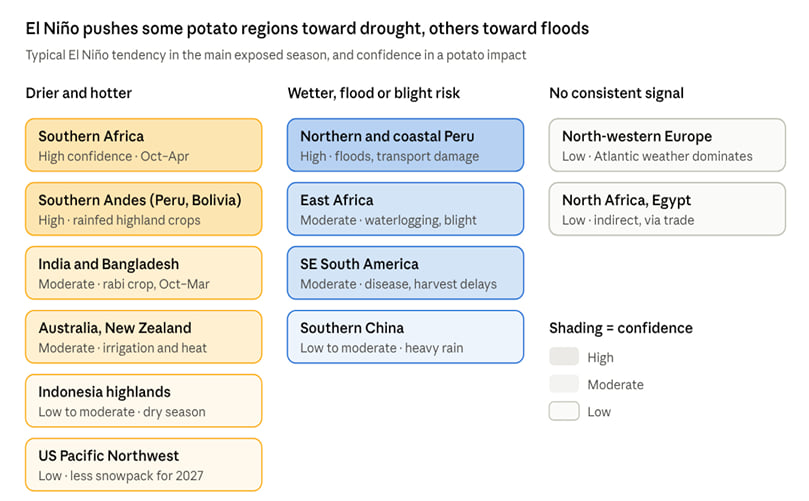
El Niño's effect on potatoes depends on the region: drought risk dominates in the southern hemisphere and South Asia, flood and blight risk in East Africa and northern Peru.
| Region | Local ENSO relationship | Main exposed season | Confidence in a potato impact |
|---|---|---|---|
| Southern Africa | Drier and hotter summer conditions | October–April | High |
| Andes (Peru, Bolivia) | Flooding in coastal and northern Peru; drought in the southern Andean highlands | September–April | High |
| South Asia (India, Bangladesh) | Potentially weaker monsoon rainfall and warmer winter conditions | October–March (rabi) | Moderate |
| East Africa | Wetter conditions during the short rains | October–December | Moderate (waterlogging and late blight risk) |
| Oceania (Australia and New Zealand) | Drier, hotter conditions in parts of southern and eastern Australia; variable effects in New Zealand | Spring–summer | Moderate |
| China and Southeast Asia | Wetter conditions in parts of southern China, variable drought risk elsewhere, and drier conditions in Indonesia | Varies by region | Low to moderate |
| North America | Warmer winters and potentially reduced snowpack in parts of the northwestern United States and western Canada, affecting subsequent irrigation supplies | Following summer (irrigation) | Low (indirect) |
| Europe | No consistent ENSO-related weather signal across major potato-growing regions | No consistent season | Low |
El Niño and potato production in Asia
India is the world's second largest potato producer, at 58.57 million tonnes in 2024–25 (Government of India final estimates). About 80–90% of the crop is grown in the winter rabi season, mostly under irrigation in Uttar Pradesh, West Bengal and Bihar. The El Niño risk works through two routes: a weak monsoon that reduces reservoir and groundwater recharge and a warm winter that shortens the cool period needed for tuber bulking.
In both recent strong El Niño years, India's output fell. Production dropped from 48 to 43.4 million tonnes in 2015–16 (PotatoPro) and from 60.14 to 57.05 million tonnes in 2023–24. However, both falls were driven mainly by West Bengal, where planting decisions and unseasonal rain played a large role. The link to El Niño is plausible but not proven.
Bangladesh saw early-season supply fall in 2023–24 after heavy rain from Cyclone Michaung delayed planting (Asia News Network). China typically sees more rain south of the Yangtze and drought risk elsewhere, while Indonesia's highland potato areas face a drier, hotter dry season.
El Niño and potato production in Europe
Europe has no reliable El Niño signal in summer, when most of its processing potatoes grow. Weather in Belgium, the Netherlands, France, Germany and the UK is driven mainly by the North Atlantic, blocking highs and long-term warming.
The 2026 season shows why attribution matters. The four NEPG countries estimate 20.7 million tonnes of ware potatoes, down 25.4% from 27.75 million tonnes in 2025 (NEPG via FreshPlaza). But planted area fell 13.7% after the 2025 price collapse and July–August heat and drought cut yields. Neither factor can be credited to El Niño. European buyers are affected indirectly through global frozen-fry competition and prices.
El Niño and potato production in North America
El Niño winters tend to be warmer and drier across the US Pacific Northwest and western Canada. The main potato risk is therefore delayed: lower snowpack in winter 2026–27 could reduce irrigation water for the 2027 crop in Idaho, Washington and Oregon, the heart of North American French fry production.
The 2026 Idaho crop shows how sensitive the region is to water. Idaho issued a statewide drought declaration in April 2026 and some eastern Idaho growers reported yields around 20% below 2025 (FreshPlaza). That drought began before El Niño formed, so it should not be attributed to it.
El Niño and potato production in South America
The Andes are the potato's home and one of the regions most exposed to El Niño. Coastal and northern Peru tend to flood, while the southern highlands around Lake Titicaca tend to dry out. About 64% of Peru's potato harvest is rainfed (AméricaEconomía).
In 2023, with a coastal El Niño and drought, Peru's potato production fell from about 6.0 to 5.4 million tonnes. In Puno, the worst-hit department, output fell from 998,000 to 596,000 tonnes. For 2026–27, Fresh Plaza reports both flood risk in the north and drought risk in the southern Andes. Southeastern South America (southern Brazil, Uruguay, northeast Argentina) is more likely to be wet, raising disease and harvest risks.
El Niño and potato production in Africa
Africa shows El Niño's two faces. Southern Africa tends to be hotter and drier. In the 2015–16 El Niño, South African farmers lost about 310,000 tonnes of fresh, processing and seed potatoes from September 2015, and market prices rose 81% year on year (Farmer's Weekly). Dryland areas such as the Eastern Free State were hit hardest. For 2026–27, South Africa starts with better soil moisture and dam levels after good 2025–26 rains.
East Africa- Kenya, Ethiopia, Rwanda, Uganda tends to be wetter in October–December. Rain helps crop establishment, but persistent wet weather raises waterlogging and late blight risk. North Africa, including Egypt, has no strong direct ENSO link; any impact comes mainly through export markets and input prices.
El Niño and potato production in Oceania
In Australia, El Niño usually brings drier, hotter conditions to the east and south, especially in winter and spring. Potato regions in Tasmania, Victoria and South Australia rely on irrigation, so the main risks are water allocation and heat during summer bulking. In New Zealand, northern and eastern areas may be drier, with Canterbury among the processing regions to watch.
El Niño Impacts on Potato Quality, Processing and Supply Chains
For processors, weather stress often matters more through quality than through tonnage. Processing quality depends mainly on two measures: specific gravity (dry matter and starch) and reducing sugars (glucose and fructose) (Northwest Potato Research).
Tuber size, dry matter and specific gravity: Heat and drought during bulking produce smaller tubers and lower dry matter. In a US study, specific gravity fell as soil temperature rose during bulking, but heat during maturation had no effect (science.gov summary).
Lower dry matter has a direct cost. As one North American storage specialist put it after the hot 2012 season, a crop with 3% lower specific gravity needs about 3% more raw potatoes to make the same volume of fries or chips. Small or short tubers also cut the yield of long fry strips. In 2026, NEPG warned that smaller, shorter tubers may force buyers to relax specifications.
Reducing sugars, fry colour and processing suitability: When reducing sugars react with amino acids during frying (the Maillard reaction), they produce brown colour and acrylamide. High sugar means dark fries and chips, failed colour specifications and higher acrylamide risk.
Heat and water stress at early bulking cause sugar ends: the stem end of the tuber holds too much glucose and fries dark. Russet Burbank is particularly prone. The sugars may not show up until two weeks or more after the stress ends and they can keep rising in storage (American Potato Journal). Heat during bulking and maturation can also remove a variety's resistance to cold induced sweetening, limiting how cold it can be stored.
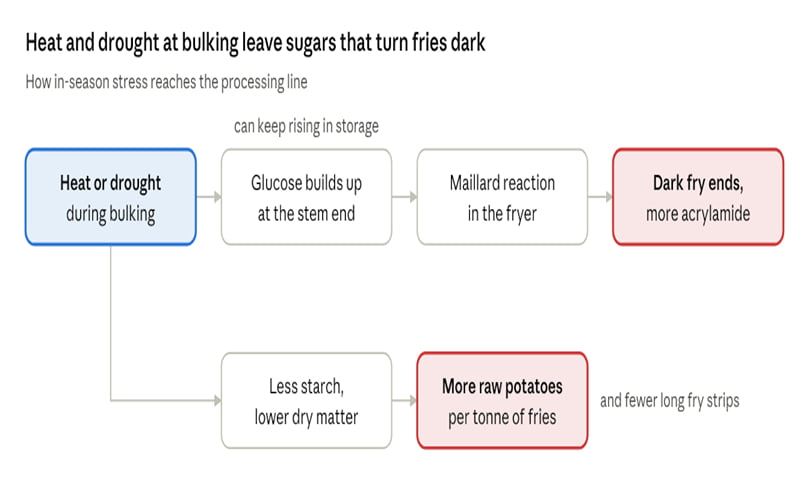
One stress event can cost processors twice: darker fries from sugar ends and more raw potatoes per tonne from lower dry matter.
Potato Processing: Chips and Frozen French Fries
| Product | Key raw-material requirements | Main El Niño-linked risks |
|---|---|---|
| Frozen French fries | Long, uniform tubers; high dry matter; low and consistent reducing sugar levels | Shorter tubers, sugar ends, uneven fry colour and lower processing yield per tonne of raw potatoes |
| Potato chips (crisps) | Round, uniform tubers; high dry matter; low reducing sugar levels | Dark chip colour, increased acrylamide formation risk and reduced storage suitability |
| Dehydrated flakes and granules | High dry matter and starch content; suitable tuber quality | Lower product recovery, increased raw material requirements and higher processing costs per tonne of finished product |
| Fresh/table potatoes | Uniform size, acceptable appearance, sound skin and freedom from major defects | Growth cracks, misshapen tubers, skin defects and increased rot risk following wet harvests |
Fry processors are usually more exposed to tuber length and sugar ends; chip makers are more exposed to overall sugar levels and storage sweetening.
Raw-material availability and processor procurement: Processors buy most of their potatoes on contracts set before planting and top up on the open (free-buy) market. When a crop is short, contracts may not be fully delivered and free-buy prices can jump. In 2026, Belgian free market processing potatoes rose from almost zero in April to USD 223.62/tonne or more (Agriland). Processors may also need to source from other regions, use more storage stock early or accept wider quality tolerances.
Storage conditions and post-harvest losses: Weather stress follows the crop into storage. Heat stressed tubers tend to age faster and break dormancy earlier, so they sprout sooner. Sugar ends can develop weeks or months after the stress. Tubers harvested from wet, waterlogged fields carry more soft rot, pink rot and late blight into store and need extra drying and ventilation. Warm autumn weather in an El Niño year can also raise the cost of cooling stores to target temperature.
El Niño, Potato Prices and Global Trade
El Niño does not automatically raise potato prices. Prices rise when supply falls short of demand in a given market and that depends on planted area, stocks, imports, demand and the weather in that region. A strong El Niño can cut supply in one region while another has a bumper crop.
Potential effects on farm-gate and wholesale prices: Because potatoes are bulky and perishable, most are eaten in the country where they are grown. A local crop failure therefore tends to move local prices sharply, while world prices barely react. The table separates measured price changes from their causes.
| Market and period | Measured change | Main cause | El Niño link |
|---|---|---|---|
| South Africa, 2016 | National market price for a 10 kg pocket: USD 0.66 in March, compared with the 2015 average of USD.0.30. ESM | Drought and heat reduced potato supply. | Strong climate connection: the 2015–16 El Niño contributed to drought conditions in southern Africa. |
| North-western Europe, October 2024–February 2025 | Producer prices increased from USD 13.98 to USD 33.56 per 100 kg. FreshPlaza/NEPG | Market supply, demand and changing price expectations following the 2024 season. | No established link: the reported price movement is not directly attributed to El Niño. |
| North-western Europe, late 2025 | Free-buy processing potato prices ranged from USD 0.56 to USD 4.47 per 100 kg. | Abundant supplies and weak demand for processing potatoes, including weaker exports of frozen fries. | No established link: market oversupply and weak demand are the relevant explanations. |
| North-western Europe, April–September 2026 | Belgian free-buy processing potato prices rose from near zero to USD 224 per tonne or more. French table potato prices opened at USD 581 per tonne, compared with USD 346 per tonne a year earlier. Agriland | Reduced planted area and summer drought affected expected production and supply. | Not established: drought-related production risks are reported, but a direct El Niño connection has not been demonstrated. |
| United States, May 2026 | Fresh potato grower prices increased by 20% month on month. USDA via FreshPlaza | Lower planted acreage and drought-related production risks. | Not established: the reported price increase alone does not demonstrate an El Niño effect. |
The European swing from glut to shortage within a year shows that area decisions and regional weather often matter more than ENSO.
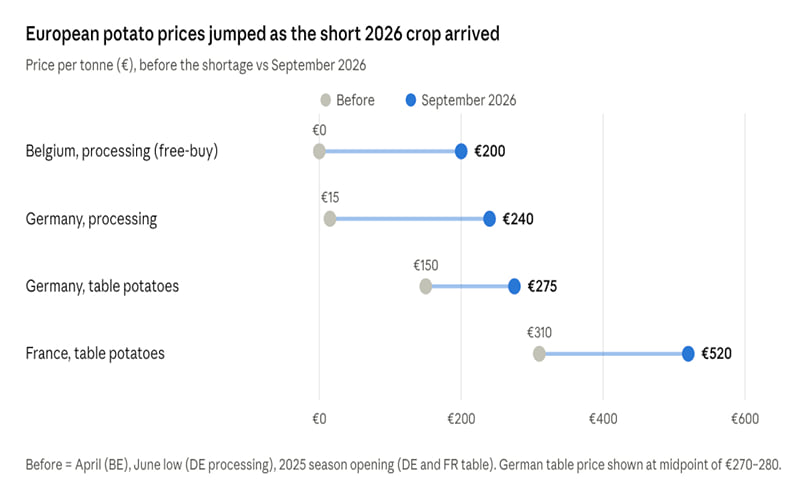
Measured 2026 price moves in Europe followed a smaller planted area and summer drought, not El Niño.
Potato imports, exports and trade flows: Fresh potato trade is mainly regional: within the EU, from the EU to North Africa and the Middle East, from Egypt to Europe and Russia and between India, Bangladesh and Nepal. Where El Niño cuts a local crop, imports from neighbours usually rise and governments sometimes restrict exports. West Bengal, for example, limited potato movement to other Indian states in 2024 to protect local supply.
Seed potato trade is also exposed. Drought or heat in seed producing areas- the Netherlands, Scotland, Idaho, Canada can reduce seed volumes and raise seed prices for the following season worldwide.
Implications for frozen potato products: Frozen French fries are the most globally traded potato product and the market is in transition. Over two seasons, China and India multiplied their frozen fry exports to neighbouring markets about tenfold, to well over 500,000 tonnes, while EU-27 exports declined (Frozen Foods Biz/NEPG). Egypt and Turkey are also growing exporters.
This matters for El Niño risk. Asian fry plants in India and China draw on regions exposed to monsoon failure and winter heat, while European and North American plants face drought risks of their own. A strong El Niño that hits India's 2026–27 rabi crop could tighten Asian fry supply at the same time as Europe's crop is already short a scenario, not a forecast.
Processing contracts and raw-material costs: Most processing potatoes in Europe and North America are grown on pre-season contracts with fixed prices and volumes. Contracts protect both sides from price swings but shift the risk to delivery: in a short year, growers may fail to fill contracts and processors must buy expensive free-buy potatoes. In a glut, processors cut contract volumes, as they did for 2026–27 after the 2025 surplus.
Weather stress also raises the cost per tonne of finished product. Lower dry matter, shorter tubers and sugar ends mean lower recovery, more rejects and more sorting.
Supply chain risks for potato businesses
- Volume risk: contracts not delivered; less storage stock for late season.
- Quality risk: dry matter, length and sugar specifications missed.
- Cost risk: higher free-buy prices, irrigation, energy for storage and freight.
- Water risk: irrigation restrictions in drought years, often with long lead times (snowpack, reservoirs).
- Logistics risk: floods damaging roads and delaying harvest, especially in Peru and East Africa.
- Policy risk: export restrictions, import tariffs and price controls during shortages
Historical El Niño Events and Potato Production
Strong El Niño events have repeatedly coincided with potato production falls in the Andes and southern Africa and less clearly in India, but not in Europe. The comparison below uses only cases with reliable national or regional data, from 1997–98 to 2023–24.
| Country / Region | El Niño event | Potato production before → during | Change | Main weather driver reported | Strength of El Niño link |
|---|---|---|---|---|---|
| Bolivia | 1997–98 | 840,000 → 505,000 tonnes | −39.9% | Highland drought | Strong |
| South Africa | 2015–16 | Record 2015 crop → about 310,000 tonnes lost from September 2015 | Market volumes −16% (January–August 2016) | Drought and record heat | Strong |
| India | 2015–16 | 48.0 → 43.4 million tonnes | −9.6% | Lower West Bengal output | Weak to moderate |
| Peru | 2023 | 6.0 → 5.4 million tonnes | −10.0% | Coastal El Niño and southern highland drought | Strong |
| Peru — Puno | 2023 | 998,000 → 596,000 tonnes | −40.3% | Prolonged drought | Strong |
| India | 2023–24 | 60.14 → 57.05 million tonnes | −5.1% | West Bengal shortfall and unseasonal rain | Weak to moderate |
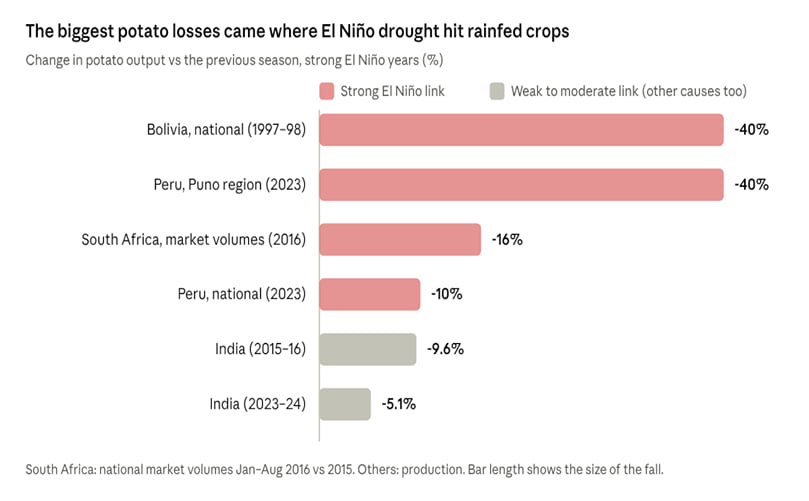
Rainfed crops in drought-prone El Niño regions lost the most; India's mostly irrigated crop fell less, with other causes involved.
Earlier El Niño events: 1982–83, 1997–98 and 2009–10
1982–83: Before 2026–27, this was the strongest El Niño on NOAA's relative index. It brought severe drought to the Altiplano of Peru and Bolivia -the potato's homeland - while coastal Peru and Ecuador flooded (Imfeld, Huerta and Lavado, 2018). Reliable crop-level potato data for that season are scarce, so the scale of potato losses cannot be quantified here.
1997–98: El Niño-linked drought in Bolivia's Andean highland valleys cut national potato output from about 840,000 to 505,000 tonnes, a fall of roughly 40%. FAO warned that seed potatoes would also be scarce for the next season. In Peru's Puno department, highland families lost much of their subsistence potato crop and in Ecuador about 300,000 hectares of farmland were severely affected by coastal rains (FAO GIEWS, June 1998).
2009–10: A moderate-to-strong El Niño coincided with one of India's weakest monsoons, with rainfall 23% below average and foodgrain output fell about 7% (ThePrint). Yet traders expected India's mostly irrigated winter potato crop to rise 6–8% that year (PotatoPro, 2009). The contrast shows how irrigation can shield potatoes from a monsoon failure as long as reservoirs and groundwater hold up.
Potato production during the 2015–2016 El Niño: The 2015–16 event was one of the strongest on record. In South Africa, it brought the worst drought in decades. Dryland areas such as the Eastern Free State were badly hit and the Sandveld in the Western Cape faced drought and heat. Potatoes South Africa reported losses of about 310,000 tonnes and market prices 81% above the previous year. Industry analysts expected prices to ease in 2017 if normal weather returned.
In India, output fell about 9.6% in 2015–16. The National Horticulture Board attributed the drop to West Bengal. The 2015 monsoon was weak, but state-level planting and market factors also played a role and the evidence does not isolate El Niño as the cause.
Potato production during the 2023–2024 El Niño: In Peru, a coastal El Niño and drought in the southern highlands cut national potato output by almost 10% in 2023, its first fall in seven years. Puno, on the Altiplano, lost about 40% of its crop. About 64% of Peru's potatoes are rainfed, which helps explain the sensitivity.
In India, output fell 5.1% in 2023–24, again led by West Bengal. Unseasonal rain from Cyclone Michaung in December 2023 delayed planting in eastern India and Bangladesh. In north-western Europe, 2023 yields were good (45.8 t/ha), but a very wet October left about 1.4 million tonnes unharvested in the fields (FreshPlaza/NEPG). Autumn rain in Europe is not a recognized El Niño effect.
Comparing weather anomalies with production and yield data
Three patterns stand out:
- Where El Niño reliably brings drought and the crop is rainfed, losses follow. South Africa's dryland areas (2015–16) and the Bolivian and Peruvian highlands (1997–98 and 2023) all match this pattern.
- Where the crop is irrigated, losses are smaller and less consistent. India's mostly irrigated rabi crop fell in both events, but by less and other causes played a large part.
- Where there is no ENSO signal, there is no consistent effect. European yields in El Niño years range from good to poor.
One limitation: national totals mix changes in area and yield. A drop can reflect farmers planting less after a year of low prices, not just weather. Yield per hectare is a better weather indicator, but it is not always published.
What historical evidence tells the potato industry
The historical record supports treating El Niño as a risk multiplier in specific regions, not as a global shock. The most exposed systems are rainfed crops in southern Africa and the Andes and irrigated systems where water supply depends on the monsoon or snowpack. With only a handful of strong events since reliable data began and with confounding factors in every case, firm conclusions about cause and effect are not justified. Planning should be based on local teleconnections, local water supply and the crop's growth stage during the event.
Latest El Niño Conditions and the Potato Industry Outlook
Status as of 12 October 2026. Forecast period: October 2026 – March 2027. Next official update: NOAA ENSO Diagnostic Discussion, 12 November 2026.
Current ENSO status and seasonal climate outlook
NOAA's Climate Prediction Center (CPC) kept its El Niño Advisory in place on 8 October 2026. Sea surface temperatures were more than +4.0°C above average in parts of the eastern equatorial Pacific. The Niño-3.4 index reached +2.1°C, Niño-3 +3.0°C and Niño-1+2 +3.9°C (NOAA CPC).
CPC gives a greater than 83% chance of a strong-to-very strong El Niño through January–March 2027. The chance of a historic event- stronger than any since 1950 on NOAA's relative index is 83% for October–December 2026. NOAA stresses that a stronger event raises the odds of typical impacts but does not guarantee them in any one place.
This event developed quickly. In March 2026, CPC still described La Niña conditions and gave El Niño only a 62% chance of emerging by June–August.
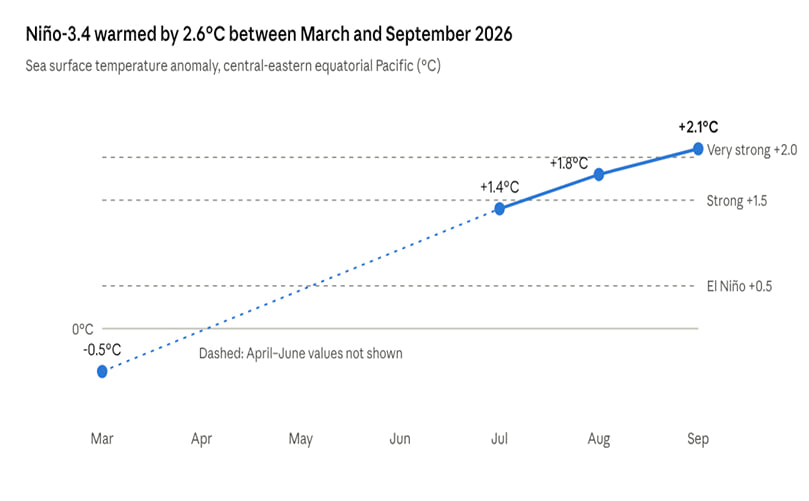
The Niño-3.4 index crossed the "very strong" threshold in September 2026.
Potato-producing regions facing potential weather risks
The World Meteorological Organization's outlook for late 2026 favours wetter conditions in the Greater Horn of Africa, southern Europe, parts of western North America and southeastern South America. It favours drier conditions over the Indian subcontinent, southern and eastern Australia, northern Europe, parts of Central America and northwestern South America (FreshPlaza).
| Region | Main potato season at risk | Potential El Niño-related signal | What to watch |
|---|---|---|---|
| India (Indo-Gangetic Plain) | Rabi crop, planted October–November 2026 | Possible changes in winter rainfall and temperatures | Reservoir levels, irrigation costs and warm spells during tuber bulking |
| China | Autumn and winter potato crops | Rainfall and temperature anomalies may vary between northern and southern China | Soil moisture, rainfall distribution and drought or waterlogging risks |
| Indonesia and Southeast Asian highlands | Dry-season and other locally scheduled crops | Higher temperatures and reduced rainfall are possible in some areas | Water availability, irrigation access and heat stress |
| Peru and the Andes | 2026–27 main planting season | Increased drought risk in some Andean areas; flooding can occur in other regions | Rainfall at planting, soil moisture and crop establishment |
| East Africa (Kenya, Ethiopia, Rwanda) | Short-rains and other locally scheduled growing seasons | Rainfall responses vary by country and season | Rainfall timing, waterlogging, late blight and field access |
| Southern Africa | 2026–27 summer growing season | Increased heat and drought risk in some areas | Irrigation demand, dam levels and water availability |
| Australia and New Zealand | 2026–27 summer growing season | Possible temperature and rainfall anomalies, particularly in parts of eastern Australia | Irrigation allocations, soil moisture and heat during tuber bulking |
| US Pacific Northwest and Canada | 2027 growing season | Possible winter temperature and precipitation anomalies affecting snowpack and water supply | Mountain snowpack, reservoir storage and irrigation water availability |
What the current outlook means for growers and processors
Measured so far: India's June–September 2026 monsoon ended about 12.6% below normal, the weakest since 2015. East and northeast India were about 25.6% short and Karnataka about 35% short (DSIJ, 3 Oct 2026). In Europe, Spain's 2026 crop is estimated at about 1.8 million tonnes, down from 1.95 million tonnes in 2025, after drought (FreshPlaza/Asonal, 25 Sep 2026). European summer drought is not a reliable El Niño signal, so it should not be attributed to El Niño.
Forecast risk, not certainty: the main exposure for 2026–27 falls on crops planted or bulking between October 2026 and March 2027. That includes India's rabi potato crop, Southern Hemisphere summer crops in Australia, South Africa and the Andes and East African crops facing excess rain. For North American processors, the bigger question is 2027 irrigation water after a possibly low-snow winter.
For processors: the practical response now is to check contract volumes against weather exposed sourcing areas, track dry matter and sugar results from the 2026 harvest and plan alternative supply before spring 2027.
El Niño, Climate Change and the Future of Potato Production
Two long-term trends shape El Niño risk for potatoes: El Niño's swings are expected to grow stronger and potato crops are warming toward their heat limits. Together, they mean the same El Niño is likely to do more damage in exposed regions in future unless growers, breeders and processors adapt.
Will El Niño become stronger or more frequent?
Most climate research points to more extreme El Niño behaviour as the planet warms, though models still disagree on details.
- More extreme events: A study of 20 climate models projected that extreme El Niño events roughly double in frequency under greenhouse warming, from about one every 20 years to about one per decade (Cai et al., Nature Climate Change, 2014).
- Already under way: A 2023 analysis of 43 models linked an increase in ENSO variability since 1960 to human caused warming. The authors expect strong El Niño events to stay more frequent for up to a century even if warming is held to 1.5°C and swings from strong El Niño to strong La Niña to become more common (CSIRO, 2023).
- Bigger rainfall swings: The IPCC's Sixth Assessment Report (2021) concluded it is very likely that rainfall variability related to ENSO will be amplified by the second half of this century under intermediate and high emissions (IPCC AR6 WGI). One modelling study found this even where ocean temperature swings do not grow (Yun et al., 2021).
Confidence is higher for stronger El Niño rainfall effects than for exactly how often events will occur. For potato planning, the practical message is the same: expect larger droughts and floods in El Niño-sensitive regions.
How warming changes potato growing conditions
Warming affects potato yields with or without El Niño and studies disagree mainly on how much adaptation and extra CO₂ can offset the heat.
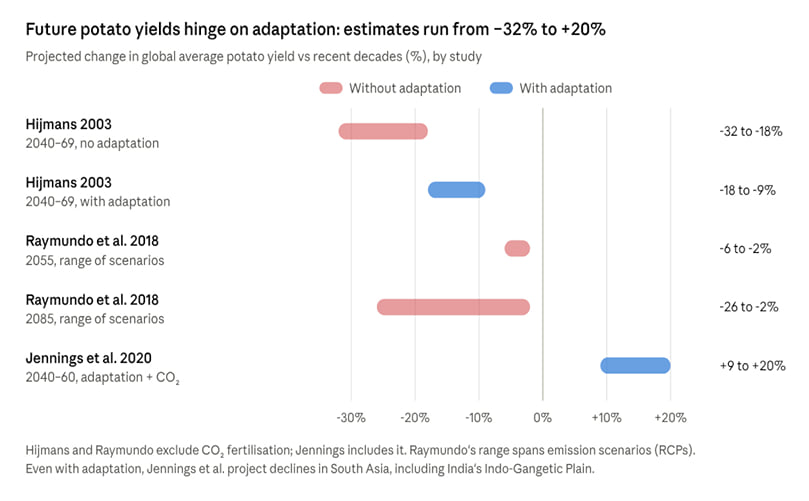
Without adaptation, most studies project global potato yield losses; with new varieties, shifted planting and CO₂ fertilization, yields could rise.
- Raymundo et al. (2018) project small global losses by 2055 and losses of up to 26% by 2085 under high emissions, with the biggest falls in high latitudes such as Eastern Europe and North America and in African lowlands. Tropical highlands are less affected.
- Jennings et al. (2020) find global yields could rise 9–20% by 2040–2060 if growers adapt and CO₂ boosts growth. But South Asia, including India's Indo-Gangetic Plain, still loses yield, because rising temperatures push the crop past tolerable limits.
- The same review notes that pests and diseases were held constant in these models, so real losses may be larger.
What a warmer world means for El Niño risk in potato regions
A warmer baseline turns moderate El Niño heat into damaging heat. If average nights during tuber bulking are already near 20°C, an El Niño warm spell is more likely to cross the thresholds at which tuber set slows or stops.
The regions where El Niño drought and long-term heat overlap face the greatest compound risk: South Asia, southern Africa and south-eastern Australia. Rainfed highland systems in the Andes remain exposed mainly through drought rather than heat. Snow-fed irrigation regions such as the US Pacific Northwest face a slower risk through shrinking snowpack.
The economic stakes are large. Callahan and Mankin estimated that El Niño events this century could cost the world economy up to USD 84 trillion once climate driven changes in their frequency and strength are included (Science, 2023). For the potato trade, a plausible scenario is more frequent years in which several exporting and importing regions are hit at once, making supply diversification more valuable.
Preparing for future El Niño events
- Use seasonal forecasts: NOAA and other agencies issue ENSO outlooks monthly. Forecasts made after the northern spring are more reliable than those made before it, so major planting and contracting decisions can be timed accordingly.
- Breed for heat and drought: Heat tolerant, drought tolerant and blight resistant varieties are the most effective long-term adaptation; potato growers' groups in Europe are already calling for them.
- Secure water: Invest in irrigation efficiency, on-farm storage and drainage, especially where reservoirs depend on monsoon or snowmelt.
- Share the risk: Weather index insurance and processing contracts with climate clauses can spread losses between growers and buyers.
- Track the data: Compare local yields per hectare with ENSO indices over time to learn how strongly your own region responds.
How Potato Producers and Processors Can Manage El Niño Risks
The most effective El Niño preparation is local: check how ENSO affects your region in your growing season, then manage water, timing, varieties and supply contracts around that risk. The earlier the plan starts, the more options remain open.
Irrigation, drainage and soil moisture management
- Plan water before planting: Check reservoir, canal and groundwater levels and any irrigation allocation limits. In snowmelt-fed regions such as Idaho, track winter snowpack from January.
- Schedule irrigation by soil moisture, not the calendar. Soil moisture sensors and evapotranspiration-based scheduling help keep the crop in the target range through tuber initiation and bulking.
- Avoid stress-then-flood cycles: Even, steady moisture reduces sugar ends, growth cracks and misshapen tubers.
- Cool the crop in heat waves: Sprinkler irrigation during heat waves can lower canopy and soil temperature; mulching helps in smallholder systems.
- In wet-risk regions, invest in drainage: Raised beds, ridging, field drains and clean ditches reduce waterlogging and rot.
Planting schedules and variety selection
- Shift planting dates where possible so tuber initiation and bulking avoid the hottest weeks or the wettest period.
- Choose heat and drought tolerant varieties for exposed fields. NEPG has repeatedly called for varieties more resilient to heat, drought and blight that need less nitrogen.
- Match variety to market for processing, check how candidate varieties hold dry matter and sugar levels under heat, not only their yield.
- Use earlier maturing varieties where the stress risk is late in the season.
Pest and disease monitoring
- Late blight: in regions expecting wetter weather (East Africa, southeastern South America, southern China), use decision support models and protective sprays before disease takes hold.
- Heat and drought linked pests: aphids, potato tuber moth and mites tend to build up in hot, dry conditions; aphids also spread viruses that reduce seed quality.
- Storage diseases: soft rot and pink rot rise after wet harvests. Grade out damaged tubers before storage.
Seed potato production and storage management
- Secure seed early: Drought or heat in seed regions can tighten supply and raise prices for the next season.
- Check physiological age: Seed from a hot season may be physiologically older and sprout earlier.
- Test before storage: Sample tubers for sugars, dry matter and defects at harvest so storage plans match quality.
- Adjust storage settings: Heat stressed or immature tubers may need different curing, temperature and sprout control plans. Plan to use the weakest lots first.
Supply diversification and procurement planning
- Map exposure List contracted volumes by region and score each against the current ENSO outlook.
- Spread sourcing across regions with different ENSO responses for example, combining northern and southern hemisphere supply or irrigated and rainfed areas.
- Build quality clauses that allow pre-agreed flexibility on tuber size, dry matter or sugar in extreme seasons.
- Hold buffer stock of finished frozen product or stored raw material ahead of the riskiest months.
- Watch official outlooks monthly: NOAA, WMO and national weather services (IMD, Australia's Bureau of Meteorology, SENAMHI in Peru, the South African Weather Service) update ENSO and seasonal forecasts regularly.
- Consider weather index insurance where available, especially for smallholder supply bases