The FAO Food Price Index hits a six-month high.
The FAO Food Price Index hits a six-month high

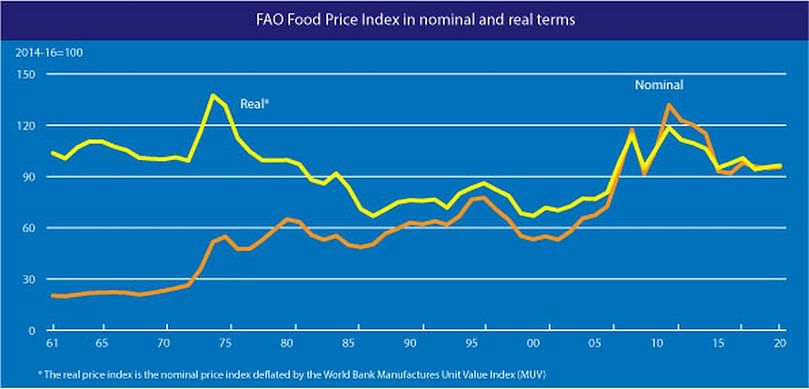
The FAO Food Price Index* averaged 96.1 points in August 2020, up 1.8 points (2.0 percent) from July and 2.1 points (2.2 percent June) higher than its level in the corresponding month last year. The August value, the highest since February 2020, represented an increase for the third consecutive month.
While a weaker U.S. dollar provided support to international prices of most agricultural commodities, in August the price increases were more pronounced for sugar and vegetable oils with cereal prices also firming, though more modestly. By contrast, meat and dairy values kept steady near their July levels.
The FAO Cereal Price Index averaged 98.7 points in August, up 1.8 points (1.9 percent) from July and 6.5 points (7.0 percent) above its value in the corresponding month last year. Among the major cereals, sorghum, barley, maize, and rice prices rose the most.
Sorghum prices increased significantly for the second consecutive month, up 8.7 percent from July and 33.4 percent above the August 2019 level, mostly on the back of strong import demand from China. Barley prices also picked up strength, increasing by 3.2 percent month-on-month, reflecting a faster pace in exports from Argentina to China.
Concerns over production prospects in the US following recent crop damages in Iowa pushed maize prices up by a further 2.2 percent in August. International rice prices also rose, after two months of successive declines, underpinned by seasonally tight availabilities and increasing African demand.
In wheat markets, export prices rose, albeit slightly, as lower production prospects in Europe and increased buying interest started to push up prices towards the end of the month.
The FAO Vegetable Oil Price Index averaged 98.7 points in August, gaining 5.5 points (5.9 percent) month-on-month and reaching its highest level since January 2020. The third consecutive monthly rise mainly reflects firmer palm oil values and, to a lesser extent, higher soy, sunflowerseed and rapeseed oil prices.
Increased international palm oil prices mainly reflect prospective production slowdowns in leading producing countries, which, combined with firm global import demand, are expected to result in reduced inventory levels.
Meanwhile, soyoil values continued to rise amid better than anticipated uptake from the US biodiesel industry. Sunflowerseed oil prices were supported by robust import demand, notably from China, while continued supply tightness underpinned the further rise in rapeseed oil values.
The FAO Dairy Price Index averaged 102.0 points in August, almost unchanged from July and up 1.7 points (1.7 percent) from the corresponding month last year. Quotations for both cheese and whole milk powder (WMP) fell due to reduced demand for spot supplies on expectations of ample export availabilities in Oceania in the new production season.
By contrast, price quotations for butter increased as a result of tightening export availabilities in Europe due to a rise in internal demand while the August hot spell reduced milk production, which was already in its seasonal decline.
Meanwhile, quotations for skim milk powder (SMP) increased, underpinned by steady global import demand for medium-term deliveries and reduced milk production in Europe.
The FAO Meat Price Index** averaged 93.2 points in August, almost unchanged from its July value and down 9.1 points (8.9 percent) from the corresponding month last year. In August, quotations for bovine and poultry meat declined, caused by a weaker pace of import purchases, notwithstanding reduced slaughter of animals and processing in key producing regions.
Meanwhile, price quotations for ovine meat fell due to weak import demand amid an influx of new season lamb supplies in Oceania. By contrast, pig meat prices rose after four months of consecutive declines, as imports by China surged while global supplies tightened somewhat due to lighter slaughter weight, coupled with prolonged plant shutdowns in some producing regions.
The FAO Sugar Price Index averaged 81.1 points in August, up 5.1 points (6.7 percent) from July and 4.9 points (6.4 percent) higher than in August 2019.
The latest month-on-month increase reflected the prospects of a reduction in production due to unfavourable weather conditions in the EU as well as in Thailand, the world’s second largest sugar exporter.
Strong sugar import demand by China, driven by a sustained rise in domestic consumption, provided additional support to prices. However, expectations of a bumper sugar crop in India contained the extent of the price increase.
* Effective July 2020, the price coverage of the FFPI has been expanded and its base period revised to 2014-2016. For more details on this revision, please see the feature article of the June 2020 issue of the Food Outlook.
** Unlike for other commodity groups, most prices utilized in the calculation of the FAO Meat Price Index are not available when the FAO Food Price Index is computed and published; therefore, the value of the Meat Price Index for the most recent months is derived from a mixture of projected and observed prices. This can, at times, require significant revisions in the final value of the FAO Meat Price Index which could in turn influence the value of the FAO Food Price Index.
来源
FAO
Sponsored Content

")
")