Unofficial US Potato Production Estimate for 2017: 0 to 3 percent below 2016
Map showing which States grow the most potatoes in the United States: grey: least, dark green: most (Courtesy: PotatoesUSA)
For more details on each state - including historical data - visit United States Potato Stats
The USDA have provided a first - unofficial - estimate on the total potato production in the United States in its 'Vegetables and Pulses Outlook' published October 27: between 0 and 3 percent below last year.
PotatoPro will follow up on this topic as the first official estimates come in, which are expected as early as later this week.
From that report:
Potatoes: Fall Area Down, Summer Area Up
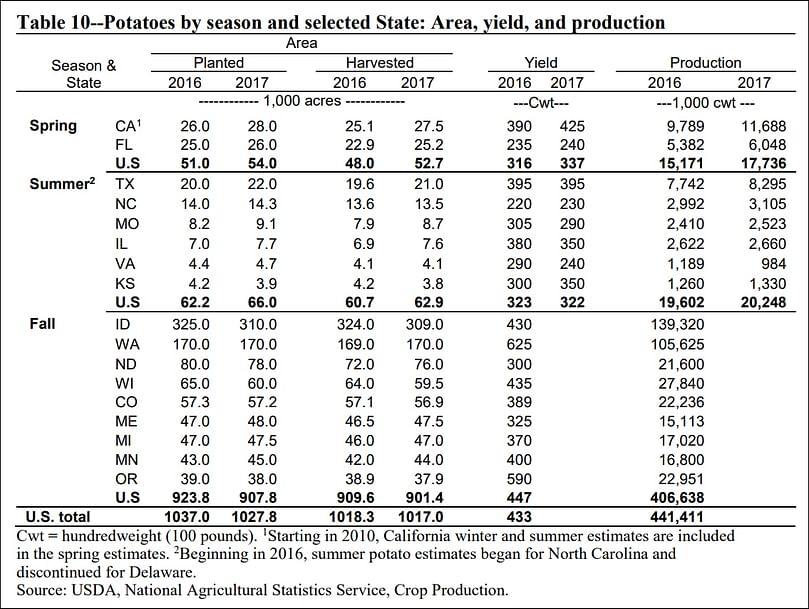
The 2017 fall-season potato acreage indicates a 2-percent decline in planted and a 1-percent
decline in harvested acreage from a year ago. U.S. fall-season potato growers planted 907,800
acres in 2017—the lowest area since 2010. Consecutive declines in the 2013/14 and 2014/15
marketing year potato prices are likely responsible for the area decreases.
Three States accounting for almost half of the 2017 crop area led the decline: Idaho, North
Dakota, and Wisconsin all had planted area declines of 34, 9, and 7 percent, respectively.
Planted area continued its rise for the summer-potato crop. At 66,000 acres, 2017 summer
planting was up 6 percent from 2016 levels, while spring plantings also increased 6 percent to
54,000 acres in 2017. The 2017 summer plantings have surpassed the spring area planted for the
second consecutive year. At 20.2 million cwt, summer forecast production, as estimated by
NASS, is up over 3 percent from 2016.
The combined U.S. planted area for all potatoes in 2017
totaled 1.028 million acres, down from last year’s 1.037 million acres (table 10).
Potato harvest in the United States in 2017 (various farms)
The first official USDA estimate of fall potato production will be released in the November 9 Crop Production report. The fall crop has accounted for about 91 percent of annual potato output during the last 10 years.
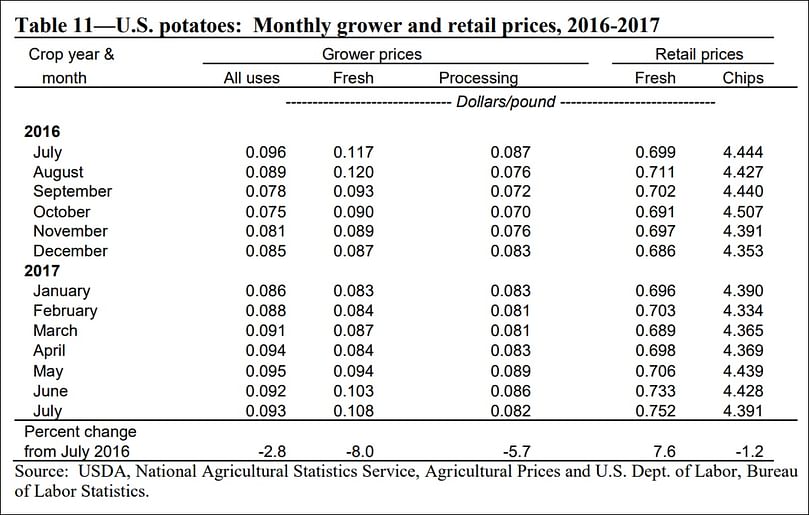
Average Prices Mixed
During the first 11 months of the marketing year (September-July), prices received by potato growers for all potatoes averaged $0.088 per pound, down less than 1 percent from last year.
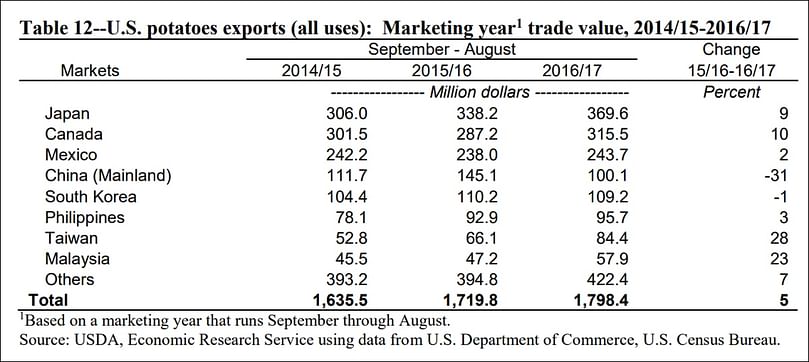
Higher export to Japan (up 9 percent) contributed to the increase in US potato exports

 Search