Lamb Weston is currently promoting topped and loaded 'Puffs' as a restaurant menu suggestion.
Potato Processor Lamb Weston reports 4% sales increase to 825 million for Q2 FY 2018

Lamb Weston Holdings, Inc. (NYSE: LW) announced its second quarter 2018 results and updated outlook for fiscal 2018 last Thursday.
Tom Werner, President and CEO:
“Our second quarter and first half results were solid.”
“Our commercial teams have worked through customer contract negotiations, and now that those discussions are largely behind us, we’re focused on our ongoing commitment to deliver industry-leading service, drive innovation and service limited time offerings with our customers.”
“Our supply chain teams continued to focus on managing cost and capacity utilization, as well as successfully starting-up our new 300 million pound french fry production line in Richland, Washington.”
“In addition, with this year’s potato crop fully harvested, we consider it to be consistent overall with historical averages, and that storability will also likely be consistent with planned expectations.”
“With our solid first half performance and some key milestones now behind us, we have better clarity on how we see the rest of the year unfolding, and have raised our annual outlook for sales growth and EBITDA accordingly.”
“We expect growth in demand to continue not just through fiscal 2018, but also for the foreseeable future.”
“To support this growth, we recently announced an additional 300 million pound french fry production line expansion in Hermiston, Oregon, to be operational in the fourth quarter of fiscal 2019.”
“This new capacity will support our customers’ growth in North America as well as Asia, where demand growth has been, and is projected to remain, strong.”
“In addition to funding this $250 million investment, we expect to generate sufficient earnings and cash flow to support the recent increase in our dividend, as well as provide flexibility to take advantage of future potential growth opportunities.”
“By continuing to take a balanced, returns-driven approach when deploying capital, we remain confident in our ability to support our customers and create value for our shareholders over the long term.”
(Click to enlarge) 
Summary of Second Quarter FY 2018 Results
Q2 2018 Commentary
Net sales were $824.6 million, up 4 percent versus the year-ago period. Price/mix increased 5 percent due to pricing actions and favorable product and customer mix. Volume declined 1 percent, as compared to a 4 percent increase in the prior year quarter.
Income from operations rose 11 percent to $139.8 million from the prior year period, and included $4.0 million of costs related to the spinoff from Conagra Brands, Inc. (formerly ConAgra Foods, Inc., “Conagra”). A portion of the increase reflects the impact of $9.0 million of expenses incurred in the prior year period related to the spinoff from Conagra. Excluding these comparability items, income from operations grew $9.3 million, driven by favorable price/mix, partially offset by commodity, manufacturing, transportation and warehousing cost inflation, higher depreciation expense and approximately $3 million of costs related to the start-up of the Company’s new french fry production line in Richland, Washington.
Adjusted EBITDA including unconsolidated joint ventures(1) was $188.9 million, up 12 percent versus the prior year quarter, reflecting growth in income from operations and equity method investment earnings.
Diluted EPS declined to $0.52 from $0.59 in the prior year period, while Adjusted Diluted EPS(1) declined to $0.54 from $0.63 in the prior year period. The declines were primarily driven by higher interest costs related to debt incurred in connection with the spinoff and higher tax expense, partially offset by growth in income from operations and equity method investment earnings.
The effective tax rate(2) was 33 percent in the second quarter of fiscal 2018, versus 27 percent in the prior year period. The lower rate in the second quarter of fiscal 2017 is primarily attributable to an increase in costs related to the spinoff from Conagra determined to be deductible, as well as a discrete benefit from fiscal 2016 foreign taxes.
Full Financial Release
For the full financial release, including additional details, the outlook for the remainder of 2018, as well as the explanations of the notes, we refer to the Lamb Weston Holdings websiteQ2 2018 Segment Highlights
Global Segment Summary
(Click to enlarge) 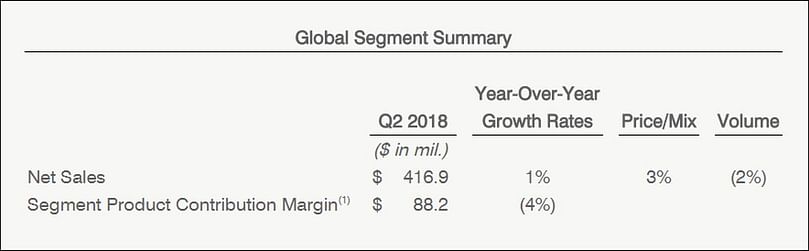
Net sales for the Global segment, which is comprised of the top 100 North American based restaurant chain customers as well as the Company’s international business, increased 1 percent to $416.9 million.Price/mix increased 3 percent, largely reflecting price increases and improvement in customer and product mix. Volume declined 2 percent, as compared to a 5 percent increase in the prior year quarter. The decline in volume is attributable to the elimination of less-profitable volume in North America and internationally as well as lower shipments to certain export markets. This was partially offset by increased shipments to strategic customers in the U.S.
Global Segment Product Contribution Margin(1) declined 4 percent to $88.2 million, with favorable price/mix offsetting commodity, manufacturing, transportation and warehousing cost inflation. Higher depreciation expense as well as start-up costs associated with the new Richland production line drove the earnings decline.
Foodservice Segment Summary
(Click to enlarge) 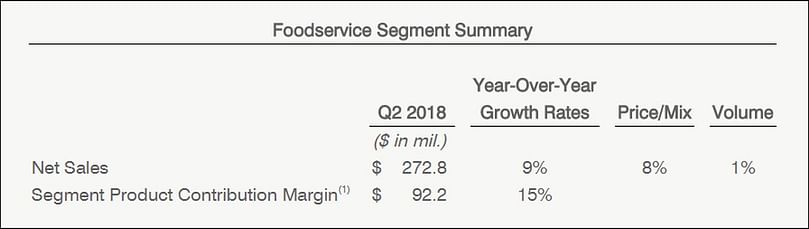
Net sales for the Foodservice segment, which services North American foodservice distributors and restaurant chains outside the top 100 North American based restaurant chain customers, increased 9 percent to $272.8 million.Price/mix increased 8 percent, reflecting the carryover effect of pricing actions taken in fiscal year 2017, pricing actions implemented in the current year, and improvement in customer and product mix. Volume increased 1 percent, as compared to a 5 percent increase in the prior year quarter, as a result of broad-based growth across the segment’s customer base.
Foodservice Segment Product Contribution Margin(1) increased 15 percent to $92.2 million, driven by favorable price/mix, partially offset by commodity, manufacturing, transportation and warehousing cost inflation, as well as higher depreciation expense and start-up costs associated with the new Richland production line.
Retail Segment Summary
(Click to enlarge) 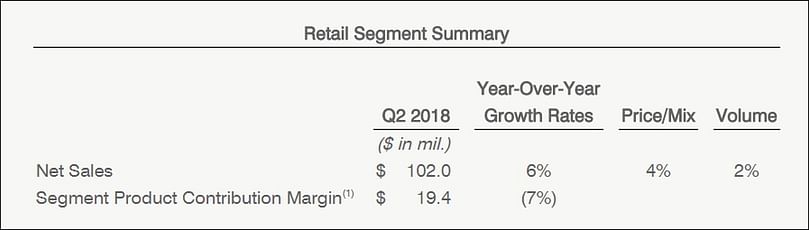
Net sales for the Retail segment, which includes sales of branded and private label products to grocery, mass merchant and club customers in North America, increased 6 percent to $102.0 million.Price/mix increased 4 percent, due to higher prices across the branded and private label portfolio, as well as improved mix, partially offset by higher trade spending in support of Grown in Idaho branded products. Volume increased 2 percent, primarily driven by distribution gains of Grown in Idaho as well as growth of Alexia and other branded products.
Retail Segment Product Contribution Margin(1) declined 7 percent to $19.4 million, mainly due to higher trade spending as well as commodity, manufacturing, transportation and warehousing cost inflation. Advertising and promotional spending also increased to support broader distribution of Grown in Idaho.
Outlook FY 2018
As summarized in the table above, the Company expects:

- Net sales to grow mid-single digits, with price/mix and volume growth improving in the second half of fiscal 2018 as new pricing structures for an increasing number of customer contracts become effective and as the Company’s new production capacity in Richland, Washington becomes available. The Company’s previous estimate was for net sales to grow low-to-mid single digits.
- Adjusted EBITDA including unconsolidated joint ventures(1) to be in the range of $780 million to $790 million, including higher selling, general and administrative expenses as a percentage of sales for fiscal 2018 due to the full-year impact of incremental costs associated with being a stand-alone public company, as well as higher advertising and promotional expense in support of the introduction of the Company’s Grown in Idaho product line in retail. Using the mid-point of the range, this represents an increase of approximately 13% percent versus a fiscal 2017 pro forma Adjusted EBITDA including unconsolidated joint ventures(1) of $692 million. The Company’s previous estimate was for Adjusted EBITDA including unconsolidated joint ventures(1) to be in the range of $740 million to $760 million.
- Total interest expense for fiscal 2018 to continue to be in the range of $105 million to $110 million, which is an increase of approximately $45 million to $50 million from fiscal 2017 due to the full-year impact of the Company’s capital structure after the spinoff from Conagra.
- Cash used for capital expenditures to be approximately $250 million for fiscal 2018, an increase of $25 million versus the previous estimate of $225 million. This increase primarily relates to costs associated with the initial phase of construction of a new production line at our Hermiston, Oregon facility.
Like to receive news like this by email? Join and Subscribe!
Get the latest potato industry news straight to your WhatsApp. Join the PotatoPro WhatsApp Community!
Uitgelichte Bedrijven


Related News

juli 14, 2026
Best Frozen Sweet Potato Fries Ranked: Alexia, Ore-Ida, and Sprouts Lead the Taste Test
A taste test of six frozen sweet potato fry brands ranked Alexia as the best overall for flavor and texture, Ore-Ida as the crispiest, and Sprouts as the top honorable mention, highlighting top picks for burgers, sandwiches, and more.
juli 08, 2026
Global Demand for Frozen French Fries Continues to Grow Despite Market Challenges
Global demand for frozen French fries grow steadily in 2026 driven by QSR expansion, retail frozen food sales and convenience trends. Rising consumption supports processing potato demand despite supply volatility, higher costs and climate risks.
juli 08, 2026
McCain Foods celebrates 18 Manufacturing Academy graduates in the United Kingdom
McCain Foods celebrated 18 Manufacturing Academy graduates in Scarborough. Since launching in 2022, the programme has enrolled 118 employees, supporting NVQ training, career progression and skills development across its four United Kingdom.