In the retail segment, Lamb Weston reported a volume increase of 22 percent, primarily driven by distribution gains of Grown in Idaho and other branded products, as well as the timing of shipments of private label products.
Potato Processor Lamb Weston reports 12% sales increase to 863 million for Q3 FY 2018

Lamb Weston Holdings, Inc. (NYSE: LW) announced its third quarter 2018 results and updated outlook for fiscal 2018 earlier this month (April 5).
Tom Werner, President and CEO:
“Our strong top- and bottom-line performance in the third quarter reflects the benefits of our capital expansion investments, our focus on delivering industry-leading customer service and our commitment to operational excellence.”
“Across each of our core businesses, we grew volume and improved price/mix to drive profit growth and expand margins.”
“Our new production line in Richland, Washington is up and running, providing us with greater flexibility across our manufacturing network to support further growth, innovation and limited time offerings for our customers, as well as allowing us to better manage costs, capacity utilization and service levels.”
“In Europe, our joint venture delivered another solid quarter by growing volume and reducing costs. As a result of our strong year-to-date performance and continued expectation of a favorable operating environment, we’ve raised our annual outlook for sales growth and Adjusted EBITDA.”
(Click to enlarge) 
Q3 2018 CommentarySummary of Third Quarter FY 2018 Results
Net sales were $863.4 million, up 12 percent versus the year-ago period. Price/mix increased 7 percent due to pricing actions and favorable product and customer mix. Volume increased 5 percent, with growth in each operating segment.
Income from operations rose 17 percent to $169.2 million from the prior year period, and included $1.7 million of costs related to the spinoff from Conagra Brands, Inc. (formerly ConAgra Foods, Inc., “Conagra”), compared with $5.1 million of expenses incurred in the prior year period related to the spinoff from Conagra.
Excluding these comparability items, income from operations grew $20.6 million, or 14 percent, driven by higher gross profit. Gross profit increased $36.9 million, due to favorable price/mix and volume, partially offset by packaging, commodity, manufacturing, transportation and warehousing cost inflation, and higher depreciation expense primarily associated with the Company’s new french fry production line in Richland, Washington.
The rise in gross profit was partially offset by a $16.3 million increase in selling, general and administrative expenses, excluding comparability items. The higher SG&A was largely a result of incremental labor and benefits and infrastructure costs associated with being a stand-alone company, higher incentive compensation expense accruals based on operating performance and increased investments in advertising and promotional support.
Adjusted EBITDA including unconsolidated joint ventures(1) was $237.6 million, up 25 percent versus the prior year quarter, reflecting growth in income from operations and equity method investment earnings.
Diluted EPS increased $0.49 to $1.06 from $0.57 in the prior year period. Approximately $0.31 of the increase relates to the Tax Cuts and Jobs Act (the “Tax Act”) enacted in December 2017, and included a $0.16 benefit from discrete items and a $0.15 benefit related to adopting a lower tax rate. The remaining increase was driven by growth in income from operations and equity method investment earnings.
Adjusted Diluted EPS(1) increased $0.32 to $0.91 from $0.59 in the prior year period, and includes a $0.15 benefit related to adopting a lower tax rate as a result of the Tax Act. The remaining increase was driven by growth in income from operations and equity method investment earnings.
The effective tax rate(2) was 4.5 percent in the third quarter of fiscal 2018, versus 33.4 percent in the prior year period. Compared with the third quarter of fiscal 2017, the Tax Act(3) decreased income tax expense by approximately $47 million. This decrease includes a provisional $24.0 million net discrete benefit, comprised of a $38.7 million non-cash benefit from the re-measurement of the Company’s net U.S. deferred tax liabilities using the new U.S. statutory tax rate, partially offset by a $14.7 million transition tax on the Company’s previously untaxed foreign earnings, which is payable over eight years.
In addition, the third quarter decrease in tax expense also includes an approximate $23 million tax benefit related to the lower U.S. corporate tax rate, which included approximately $14 million benefit related to earnings reported in the first half of fiscal 2018 and $9 million related to fiscal third quarter earnings.
In the third quarter of fiscal 2018, the Company’s effective tax rate, excluding $24.0 million of comparability items arising from the Tax Act, was 18.9%. The Company will continue to refine these amounts within the measurement period allowed by Staff Accounting Bulletin (“SAB”) No. 118, which will not exceed one year from the enactment date of the Tax Act..
Full Financial Release
For the full financial release, including additional details, the outlook for the remainder of 2018, as well as the explanations of the notes, we refer to the Lamb Weston Holdings websiteGlobal Segment Summary
(Click to enlarge) 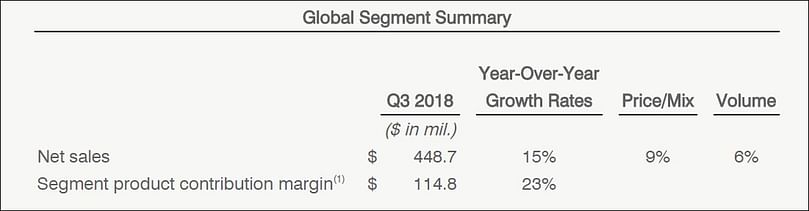
Net sales for the Global segment, which is comprised of the top 100 North American based restaurant chain customers as well as the Company’s international business, increased 15 percent to $448.7 million.Price/mix increased 9 percent, reflecting price increases as well as improvement in customer and product mix. Volume increased 6 percent, driven by the benefit of significant limited time product offerings and solid growth in sales to strategic customers in the U.S.
Global segment product contribution margin(1) increased 23 percent to $114.8 million, driven by favorable price/mix and volume growth. The increase was partially offset by packaging, commodity, manufacturing, transportation and warehousing cost inflation, as well as higher depreciation expense associated with the new Richland production line.
Foodservice Segment Summary
(Click to enlarge) 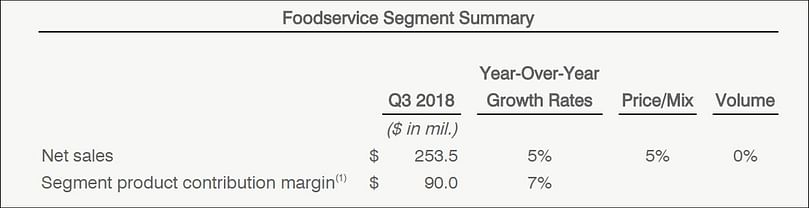
Net sales for the Foodservice segment, which services North American foodservice distributors and restaurant chains outside the top 100 North American based restaurant chain customers, increased 9 percent to $272.8 million.Price/mix increased 8 percent, reflecting the carryover effect of pricing actions taken in fiscal year 2017, pricing actions implemented in the current year, and improvement in customer and product mix. Volume increased 1 percent, as compared to a 5 percent increase in the prior year quarter, as a result of broad-based growth across the segment’s customer base.
Foodservice Segment Product Contribution Margin(1) increased 15 percent to $92.2 million, driven by favorable price/mix, partially offset by commodity, manufacturing, transportation and warehousing cost inflation, as well as higher depreciation expense and start-up costs associated with the new Richland production line.
Retail Segment Summary
(Click to enlarge) 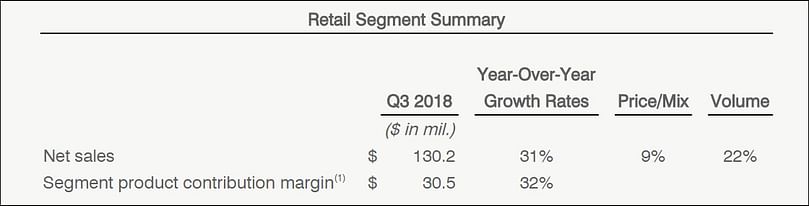
Net sales for the Retail segment, which includes sales of branded and private label products to grocery, mass merchant and club customers in North America, increased 31 percent to $130.2 million.Volume increased 22 percent, primarily driven by distribution gains of Grown in Idaho and other branded products, as well as the timing of shipments of private label products.
Price/mix increased 9 percent, due to higher prices across the private label and branded portfolios, as well as improved mix, partially offset by higher trade investments to support expanded distribution of Grown in Idaho branded products.
Retail segment product contribution margin(1) increased 32 percent to $30.5 million, mainly due to higher volume and price/mix. The increase was partially offset by packaging, manufacturing, transportation and warehousing cost inflation, as well as higher trade investments and advertising and promotional support behind Grown in Idaho branded products.

As summarized in the table above, the Company expects:
- Net sales to grow at the upper end of the mid-single digit range, driven by solid price/mix and volume growth. The Company’s previous estimate was for net sales to grow mid-single digits.
- Adjusted EBITDA including unconsolidated joint ventures(1) to be in the range of $805 million to $810 million, including higher selling, general and administrative expenses as a percentage of sales for fiscal 2018 due to the full-year impact of incremental labor and benefits and infrastructure costs associated with being a stand-alone public company, higher incentive compensation expense accruals as a result of the Company’s operating performance, and higher advertising and promotional expense in support of the introduction of the Company’s Grown in Idaho product line in retail.
Using the mid-point of the range, this represents an increase of approximately 17% percent versus a fiscal 2017 pro forma Adjusted EBITDA including unconsolidated joint ventures(1) of $692 million. The Company’s previous estimate was for Adjusted EBITDA including unconsolidated joint ventures(1) to be in the range of $780 million to $790 million.
In addition, the Company expects:
- Total interest expense for fiscal 2018 to be approximately $110 million, which is an increase of approximately $50 million from fiscal 2017 due to the full-year impact of the Company’s capital structure after the spinoff from Conagra. The Company’s previous estimate was for total interest expense to be in the range of $105 million to $110 million.
- A blended estimated effective tax rate(2) excluding comparability items of approximately 28 percent, which reflects the effect of a lower U.S. corporate tax rate as a result of the Tax Act. The Company’s previous estimate was for an effective tax rate of 33 to 34 percent.
- Cash used for capital expenditures to be between $270 million and $280 million for fiscal 2018, up from the Company’s previous estimate of $250 million. The increase of between $20 million and $30 million reflects the acceleration of spending for the initial phase of construction of a new 300 million pound french fry production line at the Company’s Hermiston, Oregon facility that will support customers’ growth in North America as well as Asia. The Company continues to expect this $250 million production line to be completed during the fourth quarter of fiscal 2019.
Like to receive news like this by email? Join and Subscribe!
Get the latest potato industry news straight to your WhatsApp. Join the PotatoPro WhatsApp Community!
精选企业


Related News

七月 17, 2026
Lamb Weston to showcase new potato innovations at WOFEX 2026
Lamb Weston will showcase Snap Fries, Frenzy Fries and Original Mash Cup at WOFEX 2026 in Manila, highlighting potato innovations designed to help airlines and foodservice operators improve efficiency, flexibility and menu differentiation.
七月 14, 2026
Best Frozen Sweet Potato Fries Ranked: Alexia, Ore-Ida, and Sprouts Lead the Taste Test
A taste test of six frozen sweet potato fry brands ranked Alexia as the best overall for flavor and texture, Ore-Ida as the crispiest, and Sprouts as the top honorable mention, highlighting top picks for burgers, sandwiches, and more.
七月 08, 2026
Global Demand for Frozen French Fries Continues to Grow Despite Market Challenges
Global demand for frozen French fries grow steadily in 2026 driven by QSR expansion, retail frozen food sales and convenience trends. Rising consumption supports processing potato demand despite supply volatility, higher costs and climate risks.