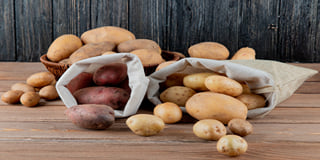

The Global Potato Industry: Statistics, Trade and Prices
The world harvested about 390 million tonnes of potatoes in 2024 on roughly 17 million hectares, according to FAOSTAT. That total is the starting point for three kinds of information the potato industry depends on. Statistics show how much is grown, where, and how efficiently. Trade data show how fresh potatoes, seed potatoes and processed products move between countries. Prices show what growers, packers, processors and buyers actually receive or pay.
These three are closely linked. A large harvest in one region changes how much is available for export, how much processors can contract, and where prices settle. This page gives an overview of each and links to the pages where they are covered in depth, including country-by-country data in PotatoPro's regional potato statistics.
Global Potato Production, Consumption and Market Statistics
Production and Harvested Area:
The FAOSTAT update released at the end of 2025 puts world potato production at 390.4 million tonnes in 2024, about 1% more than in 2023. The harvested area was 17.08 million hectares and the average world yield about 22.9 tonnes per hectare. Asia produced 52.6% of the world crop.
FAO publishes complete global data about a year after harvest, so 2024 is the latest full year available. FAO also revises earlier years as countries report final figures, which is why totals for the same year can differ slightly between releases.
Leading Potato-Producing Countries:
Production is highly concentrated. China and India together grow almost four in ten of the world's potatoes, and the five largest producers account for more than half of global output. The full ranking of more than 25 countries, with yearly data for each, is on PotatoPro's world potato production and consumption page.
Leading Potato Producers and Their Share of World Output, 2024
Yield and Productivity: The world average yield hides very large differences. In the United States, the USDA Potatoes 2025 Summary reports an average yield of 462 hundredweight per acre, which is more than 50 tonnes per hectare. North-west European growers commonly harvest 40 to 50 tonnes per hectare. Many producing countries in Asia and Africa remain well below the world average. The gap reflects differences in seed potato quality and varieties, irrigation, crop protection, mechanisation and storage. Closing part of it is the main source of future production growth.
Consumption: FAOSTAT food balance data put average potato consumption at about 33 kg per person a year. This figure includes processed products converted back to fresh-potato weight. Consumption is highest in Eastern Europe, where potatoes remain a daily staple, and lowest across much of Africa. Total demand is growing fastest in Asia, as rising incomes and quick-service restaurants increase demand for fries and snacks.
Fresh Use, Processing and Seed: Each crop is divided between the fresh (table) market, processing, seed for the next season, animal feed and storage losses. The balance varies widely by country. In the United States, processing is the largest outlet. Growers sold 388 million hundredweight of potatoes from the 2025 crop, according to the USDA Potatoes 2025 Summary. Of this, 267 million went to processors and 101 million to the table market, and frozen fries and other frozen products alone used 173 million hundredweight.
Seed potatoes deserve separate attention. They are a small share of the tonnage, but the health and quality of seed set the yield potential of the whole crop. Regional differences in climate also shape the market. These include single or multiple harvests per year, the need for long-term storage, and the amount of local processing capacity. Together they decide when potatoes reach the market and how long supplies last. The route from field to consumer is described in the guide to the potato supply chain.
Global Potato Trade: Fresh, Seed and Processed Potato Markets
Potatoes are not a globally listed commodity like wheat or sugar. Fresh potatoes are bulky, perishable and subject to strict plant health rules, so most are grown and eaten in the same country. International trade therefore falls into three distinct segments, and each one behaves differently.
Fresh and chilled potatoes: World trade in fresh potatoes (HS 0701) was worth about US$ 7.1 billion in 2024. Ware potatoes made up US$ 5.8 billion of this and seed potatoes US$ 1.3 billion. France, the Netherlands and Germany are the largest exporters, and much of the fresh trade takes place between European countries. Belgium, the Netherlands and Spain are the largest importers.
Seed potatoes: Seed potatoes travel further. European and Canadian seed is shipped to North Africa, the Middle East and Asia, under phytosanitary certification agreed between exporting and importing countries.
Processed potatoes: Frozen French fries and other prepared potato products are worth far more than fresh potatoes in international trade. Belgium is the largest exporter of frozen fries, with exports of about US$ 4.1 billion in 2024. The Netherlands, Canada and the United States follow. China, India and Egypt have become fast-growing fry exporters to Asia, the Middle East and Africa.
Comparing trade data requires care. Values and volumes often move in different directions. Product codes separate seed, ware, frozen, dehydrated and starch products. Some countries report by calendar year and others by marketing year. Used correctly, trade data show businesses where demand is growing, which origins compete in each market and how market shares are shifting.
For more information on potato trade, including detailed import and export statistics, the leading exporting and importing countries, trade routes and market developments, see the full article here: Potato Trade.
International potato trade has three segments: fresh, seed and frozen products. Frozen potato exports are now worth almost twice fresh potato trade.
Global Potato Price Trends: Farm-Gate, Wholesale and Retail Markets
There is no single world price for potatoes. Prices are set in local and regional markets, and they differ by market level:
- Farm-gate prices are what growers receive.
- Wholesale prices are quoted at terminal and regional markets, such as Indian mandis or US shipping points.
- Retail prices include washing, packing, transport and the retailer's margin.
Seed potatoes command a premium because of the cost of certification, testing and specialised multiplication. Processing potatoes are largely grown under contracts agreed with fry and chip makers before planting. Only a small share of the crop is sold on the free market, and it is free-market prices that swing most.
Prices move with supply and demand. The main factors are planted area, weather and harvest volumes, storage stocks and how well potatoes keep, transport costs, quality and processing demand. Because fresh potatoes do not travel far, a shortage in one country can coincide with a surplus in a neighbouring one. In April 2026, after a record crop in north-west Europe, the Belgian free-market quotation fell to zero and growers were allowed to spread surplus potatoes on their fields.
Export and import unit values, which are calculated by dividing trade value by volume, are a useful indicator. They are not the same as market quotations or actual transaction prices. They average across grades, packaging, destinations and contract terms, and they often include transport costs.
For more information on potato prices, including current prices by country, historical price trends, seasonal patterns and the factors that move potato markets, see the full article here: Potato Prices.
How Potato Production, Trade and Prices Are Connected
The 2025–2026 season in north-west Europe shows how the three interact. In 2025, growers in Belgium, France, Germany and the Netherlands harvested a record ware potato crop of about 27.75 million tonnes from an expanded area. Supply exceeded what processors and fresh buyers needed, storage filled up, frozen fry exports weakened and free-market prices collapsed. Processors cut 2026 contract prices by roughly 15–25%, and growers reduced their planted area by 10–17%, depending on the country. A hot, dry summer then cut yields further. In September 2026 the North-Western European Potato Growers (NEPG) forecast the 2026 ware crop at about 20.7 million tonnes, 25.4% below 2025. With supply tighter again, the Belgian free-market quotation for Fontane had recovered to around EUR 200 per tonne by late September. Contract prices, agreed before planting, moved far less in both directions.
The same chain does not play out identically everywhere. How strongly a harvest change affects trade and prices depends on several things: whether the potatoes meet processing specifications, how much can be stored and for how long, whether export markets are open to that origin, how competitive other suppliers are, and how firm demand is from processors and consumers. A large crop of the wrong size or quality may do little to ease a shortage, and an open export market can absorb a surplus that would otherwise depress local prices. The growing effects of heat and drought on these swings are covered in the guide to climate change and potatoes.
Sources for Potato Statistics and Market Data
Each data source measures something different, and figures from different sources should not be mixed without checking product scope, units and reporting periods.
| Source | What it measures | Limitations |
|---|---|---|
| FAOSTAT | Production, harvested area, yield, producer prices and food balances for all countries | About one year delay; some country figures are FAO estimates |
| UN Comtrade | Official import and export values and volumes by HS product code | Reporting gaps and differences between exporter and importer records |
| ITC Trade Map | Trade flows, market shares and trends built on Comtrade and national data | Free registration required; same classification limits as Comtrade |
| Eurostat | Potato area, production and trade for EU member states | EU coverage only |
| USDA NASS | US acreage, production, stocks, use and grower prices | United States only |
| Agmarknet | Daily arrivals and wholesale prices at Indian markets | Wholesale prices only; quality and data completeness vary by market |
The latest crop estimates, market reports and price movements from every region are collected in PotatoPro's news on potato stats, trade and prices.
Explore Potato Trade and Prices
Potato Trade: detailed international imports and exports, trade values, volumes and leading markets.
Potato Prices: detailed market quotations, historical price trends and the factors that influence potato prices.
Read together, production statistics, trade data and price information give the clearest picture of where the global potato market stands and where it is heading.