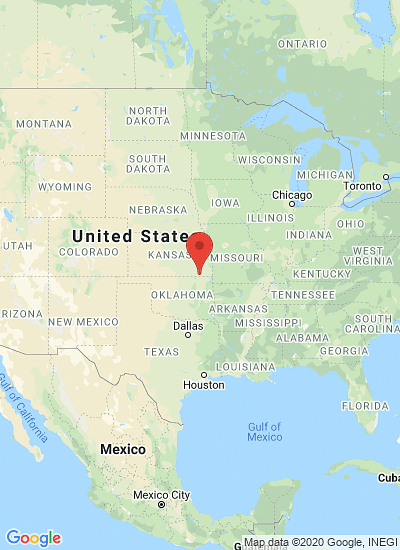
Map showing which States grow the most potatoes in the United States: grey: least, dark green: most (Courtesy: PotatoesUSA)
For more details on each state - including historical data - visit United States Potato Stats
Unofficial US Potato Production Estimate for 2017: 0 to 3 percent below 2016

The USDA have provided a first - unofficial - estimate on the total potato production in the United States in its 'Vegetables and Pulses Outlook' published October 27: between 0 and 3 percent below last year.
PotatoPro will follow up on this topic as the first official estimates come in, which are expected as early as later this week.
From that report:
Potatoes: Fall Area Down, Summer Area Up
The 2017 fall-season potato acreage indicates a 2-percent decline in planted and a 1-percent decline in harvested acreage from a year ago. U.S. fall-season potato growers planted 907,800 acres in 2017—the lowest area since 2010. Consecutive declines in the 2013/14 and 2014/15 marketing year potato prices are likely responsible for the area decreases.
Three States accounting for almost half of the 2017 crop area led the decline: Idaho, North Dakota, and Wisconsin all had planted area declines of 34, 9, and 7 percent, respectively.
Planted area continued its rise for the summer-potato crop. At 66,000 acres, 2017 summer planting was up 6 percent from 2016 levels, while spring plantings also increased 6 percent to 54,000 acres in 2017. The 2017 summer plantings have surpassed the spring area planted for the second consecutive year. At 20.2 million cwt, summer forecast production, as estimated by NASS, is up over 3 percent from 2016.
The combined U.S. planted area for all potatoes in 2017 totaled 1.028 million acres, down from last year’s 1.037 million acres (table 10).
(Click to enlarge) 
Potatoes by Season and State: Area, yield and production.
Fall crop yield estimates are expected November 9
As of October 16, the potato harvest was wrapping up in Idaho, despite a slower pace earlier in the month due to cooler weather and precipitation. Idaho potato crop condition rated good is 62 percent compared to 82 percent the same week last year.
Colorado, Oregon, and Minnesota also experienced a slower potato harvest pace as of October 16 compared to last year. The crop condition in Colorado’s San Luis Valley is rated 55 percent good, compared to 66 percent good last year (USDA NASS)..
(Click picture to watch video) ")
Potato harvest in the United States in 2017 (various farms)
Given the increase in acreage this spring and summer and forecast fall acreage expected to decline, combined with yields closely matching last year, the 2017 potato crop is projected to range from 428 to 441 million hundredweight (cwt)—between 0 and 3 percent below last year.
The first official USDA estimate of fall potato production will be released in the November 9 Crop Production report. The fall crop has accounted for about 91 percent of annual potato output during the last 10 years.
Average Prices Mixed
During the first 11 months of the marketing year (September-July), prices received by potato growers for all potatoes averaged $0.088 per pound, down less than 1 percent from last year.
(Click to enlarge) ")
Monthly grower and retail prices (2016-2017)
Despite relatively strong prices early in the year, during the usual peak period for all potato prices, April, May and June, prices were lower than last year’s levels—down over 6 percent, and down over 5 percent from the past 3-year average all-potato price.
From September through July, grower prices for fresh-market potatoes averaged $0.094 per pound--6 percent below year-previous levels. Prices were lower at the retail level for chip potatoes during the first 11 months of the marketing year (September-July), and averaged 2 percent below a year earlier while retail prices for fresh potatoes averaged 7 percent higher (table 11).
Potato Exports Continue Up
During the September-August marketing year, U.S. exports of all potatoes and potato products (including starch) totaled $1.8 billion - 5 percent above a year earlier..
 contributed to the increase in US potato exports")
Higher export to Japan (up 9 percent) contributed to the increase in US potato exports
The increase in U.S. potato exports is largely attributed to higher exports to Japan (up 9 percent) and Canada (up 10 percent). Japan remained the leading foreign market with 21 percent of export value, followed by Canada (18 percent), Mexico (14 percent), and China and South Korea (6 percent each) (table 12).
(Click to enlarge) 
United States Export of Potatoes and Potato Products
While exports are expanding, driven by increased demand from Taiwan ($8.5 million in 2016/17), the Philippines ($7.6 million), and Malaysia ($1 million), U.S. potato imports are also increasing.
All potatoes and potato products imported during the 2016/17 marketing year totaled $1.33 billion—9 percent above a year earlier. Imported potatoes are comprised primarily of frozen fries, which represent over half of total potato import value.
Canada currently accounts for 98 percent of all frozen fries imported (table 13).
(Click to enlarge) 
United States Potato and Potato Product Exports and Imports - by product type - marketing year trade value to date
Like to receive news like this by email? Join and Subscribe!
Get the latest potato industry news straight to your WhatsApp. Join the PotatoPro WhatsApp Community!
Related News

juli 21, 2026
Solynta Expands Hybrid True Potato Seed Portfolio with SOLHY023 Approval in Kenya
Solynta has secured approval for its hybrid true potato seed variety SOLHY023 in Kenya, expanding its HTPS portfolio with stronger late blight resistance and supporting resilient, disease-free potato production through advanced hybrid breeding.
juli 21, 2026
Global Seed Potato Trade Enters a New Biosecurity Era as Countries Strengthen Phytosanitary Controls
Global seed potato trade is entering a new biosecurity era as countries tighten phytosanitary rules, expand digital ePhyto certification, and strengthen disease testing, making certified, traceable seed essential for global market access.
juli 17, 2026
Dutch Growers and NAO Back Crop Protection Covenant to Advance Sustainable Potato and Plant Sectors
Dutch growers and the Dutch Potato Organisation (NAO) support the Outline Crop Protection Covenant to reduce environmental impacts, improve water quality and boost innovation while promoting legal certainty and sustainable potato production.